
Building Tools for an Audience of One
We don’t need conspiracy theories to understand money in politics. We need facts and data.

I’m old enough to know the psychological burden of having yet another software project out there that needs ongoing development and maintenance. I’ve been involved in the software development industry in technology for 25 years in some form or another. Developer, software architect, platform architect, enterprise architect, product manager, business owner. Software projects require investments of time, money, and skill regardless of your role.
My interest in campaign finance and US federal elections comes from connecting the dots that all aspects of life are inherently political. I’m not talking about the radical increase in the number of people screaming into the internet void about their particular issue. I’m talking about the undeniable fact that regardless of your issues, there exists someone, somewhere, that will pay insane amounts of money to either keep the status quo, or dramatically change the status quo. If you don’t think this is the case, you might want to remove your rose-colored glasses.
Let’s look at an example so we’re all on the same page. This excellent Reuters article notes US Data Privacy Laws to enter new era in 2023. It’s about data privacy legislation and the impact of a “harms-based” approach versus a “rights-based” approach. Why is this important? Look no further than World War 2, when Nazis collected data on the population and, based on that data, carried out the most heinous crimes in the history of our species. This continued throughout the 1950s, 60s, 70s, and 80s through the communist regime in East Germany. Genocide and thoughtcrimes are potential outcomes from poorly regulated data privacy controls. Elected officials are responsible for this legislation and its outcomes.
How did these officials come to be elected? Someone wanted them elected. Not merely the voting public. Someone. Possibly, probably, a group of someones. Now, let me assuage your fears right now that this is some lunatic fringe conspiracy theory author. We don’t need to bring conspiracy to the table when the facts will do just fine. Not alternative facts. Facts. And we can find out the facts because the US government thankfully makes political campaign finance data available in the raw at the federal level. This data makes everything transparent, at least in theory.
Why do I bring up “alternative facts” and conspiracy theories? To dispense with them. I think “both sides” are quick to jump to conclusions that US federal elections are “stolen”, “corrupt”, elections can be bought, and there is too much money in politics in the wake of Citizen's United. These lunatic theories are spoken out loud because most people, forget about average people, most people do not understand how the election cycle works and they certainly do not understand the role of money in politics. Yes, there is a ton of money in politics. That should not imply there is too much or too little money in politics. Fringe theories come up because money is being spent for or against people’s pet issues, their identity politics, and they don’t understand where this unstoppable force came from. Eliminating money in politics isn’t going to happen without a Constitutional Amendment, the only thing we can do is accept there is an incredible amount of money in politics, and try to understand why it’s the way it is. Once we understand the why, we can explore the “what” and the “how”. We don’t need conspiracy theories to understand money in politics. We need facts and data.
Where do we get the facts and data? Facts are all around us. In the news. In front of our eyes. You can see it in your world, influenced by elected officials. The data comes from the FEC. This is an official US government source with excellent documentation on the data itself, as well as a robust legal advisory section with hundreds of decision records and advisories. In general, the FEC does a good job making tools to explore campaign finance data on their website. For raising money and spending money, the FEC site offers an easy intro widget to see what’s going on at a high level.
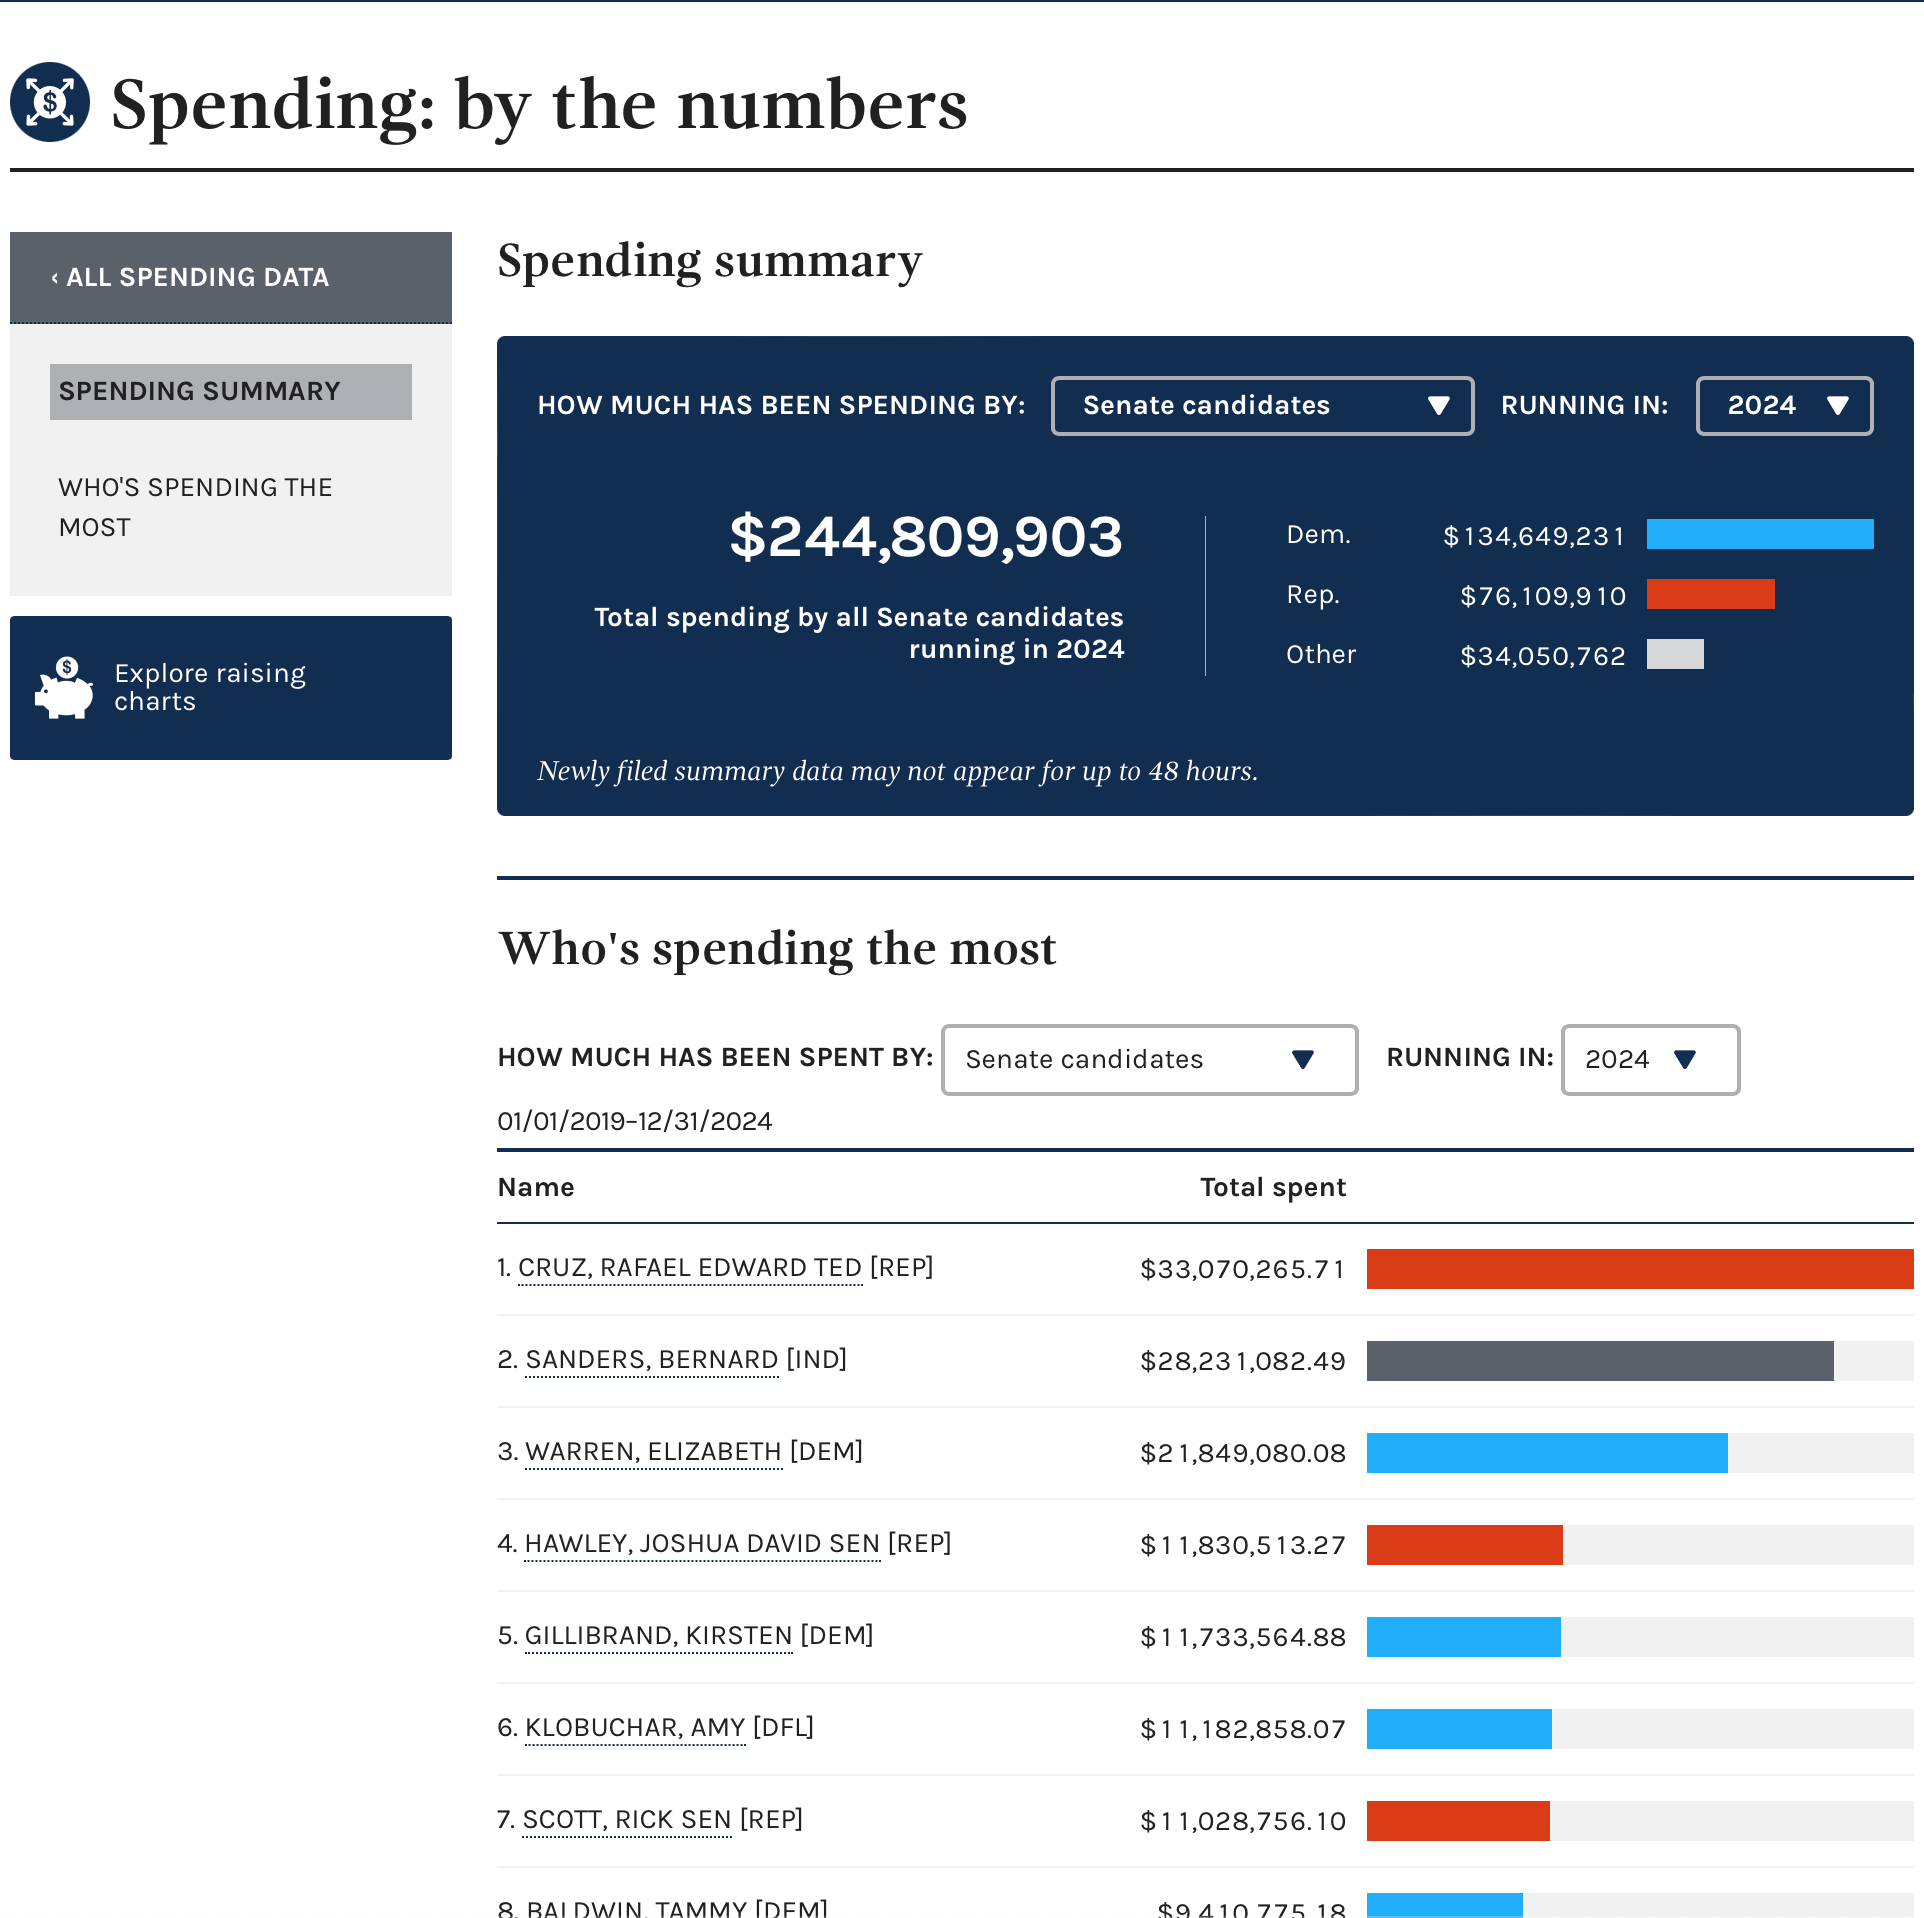
Not a bad widget. Here is the US Senate candidate breakdown. The usual suspects are on the list. We can break it down further by clicking on a candidate or we can switch to candidates for the House of Representatives or the President of the United States. Continuing to more detailed searches in disbursements, the FEC continues to provide strong UX for researchers.
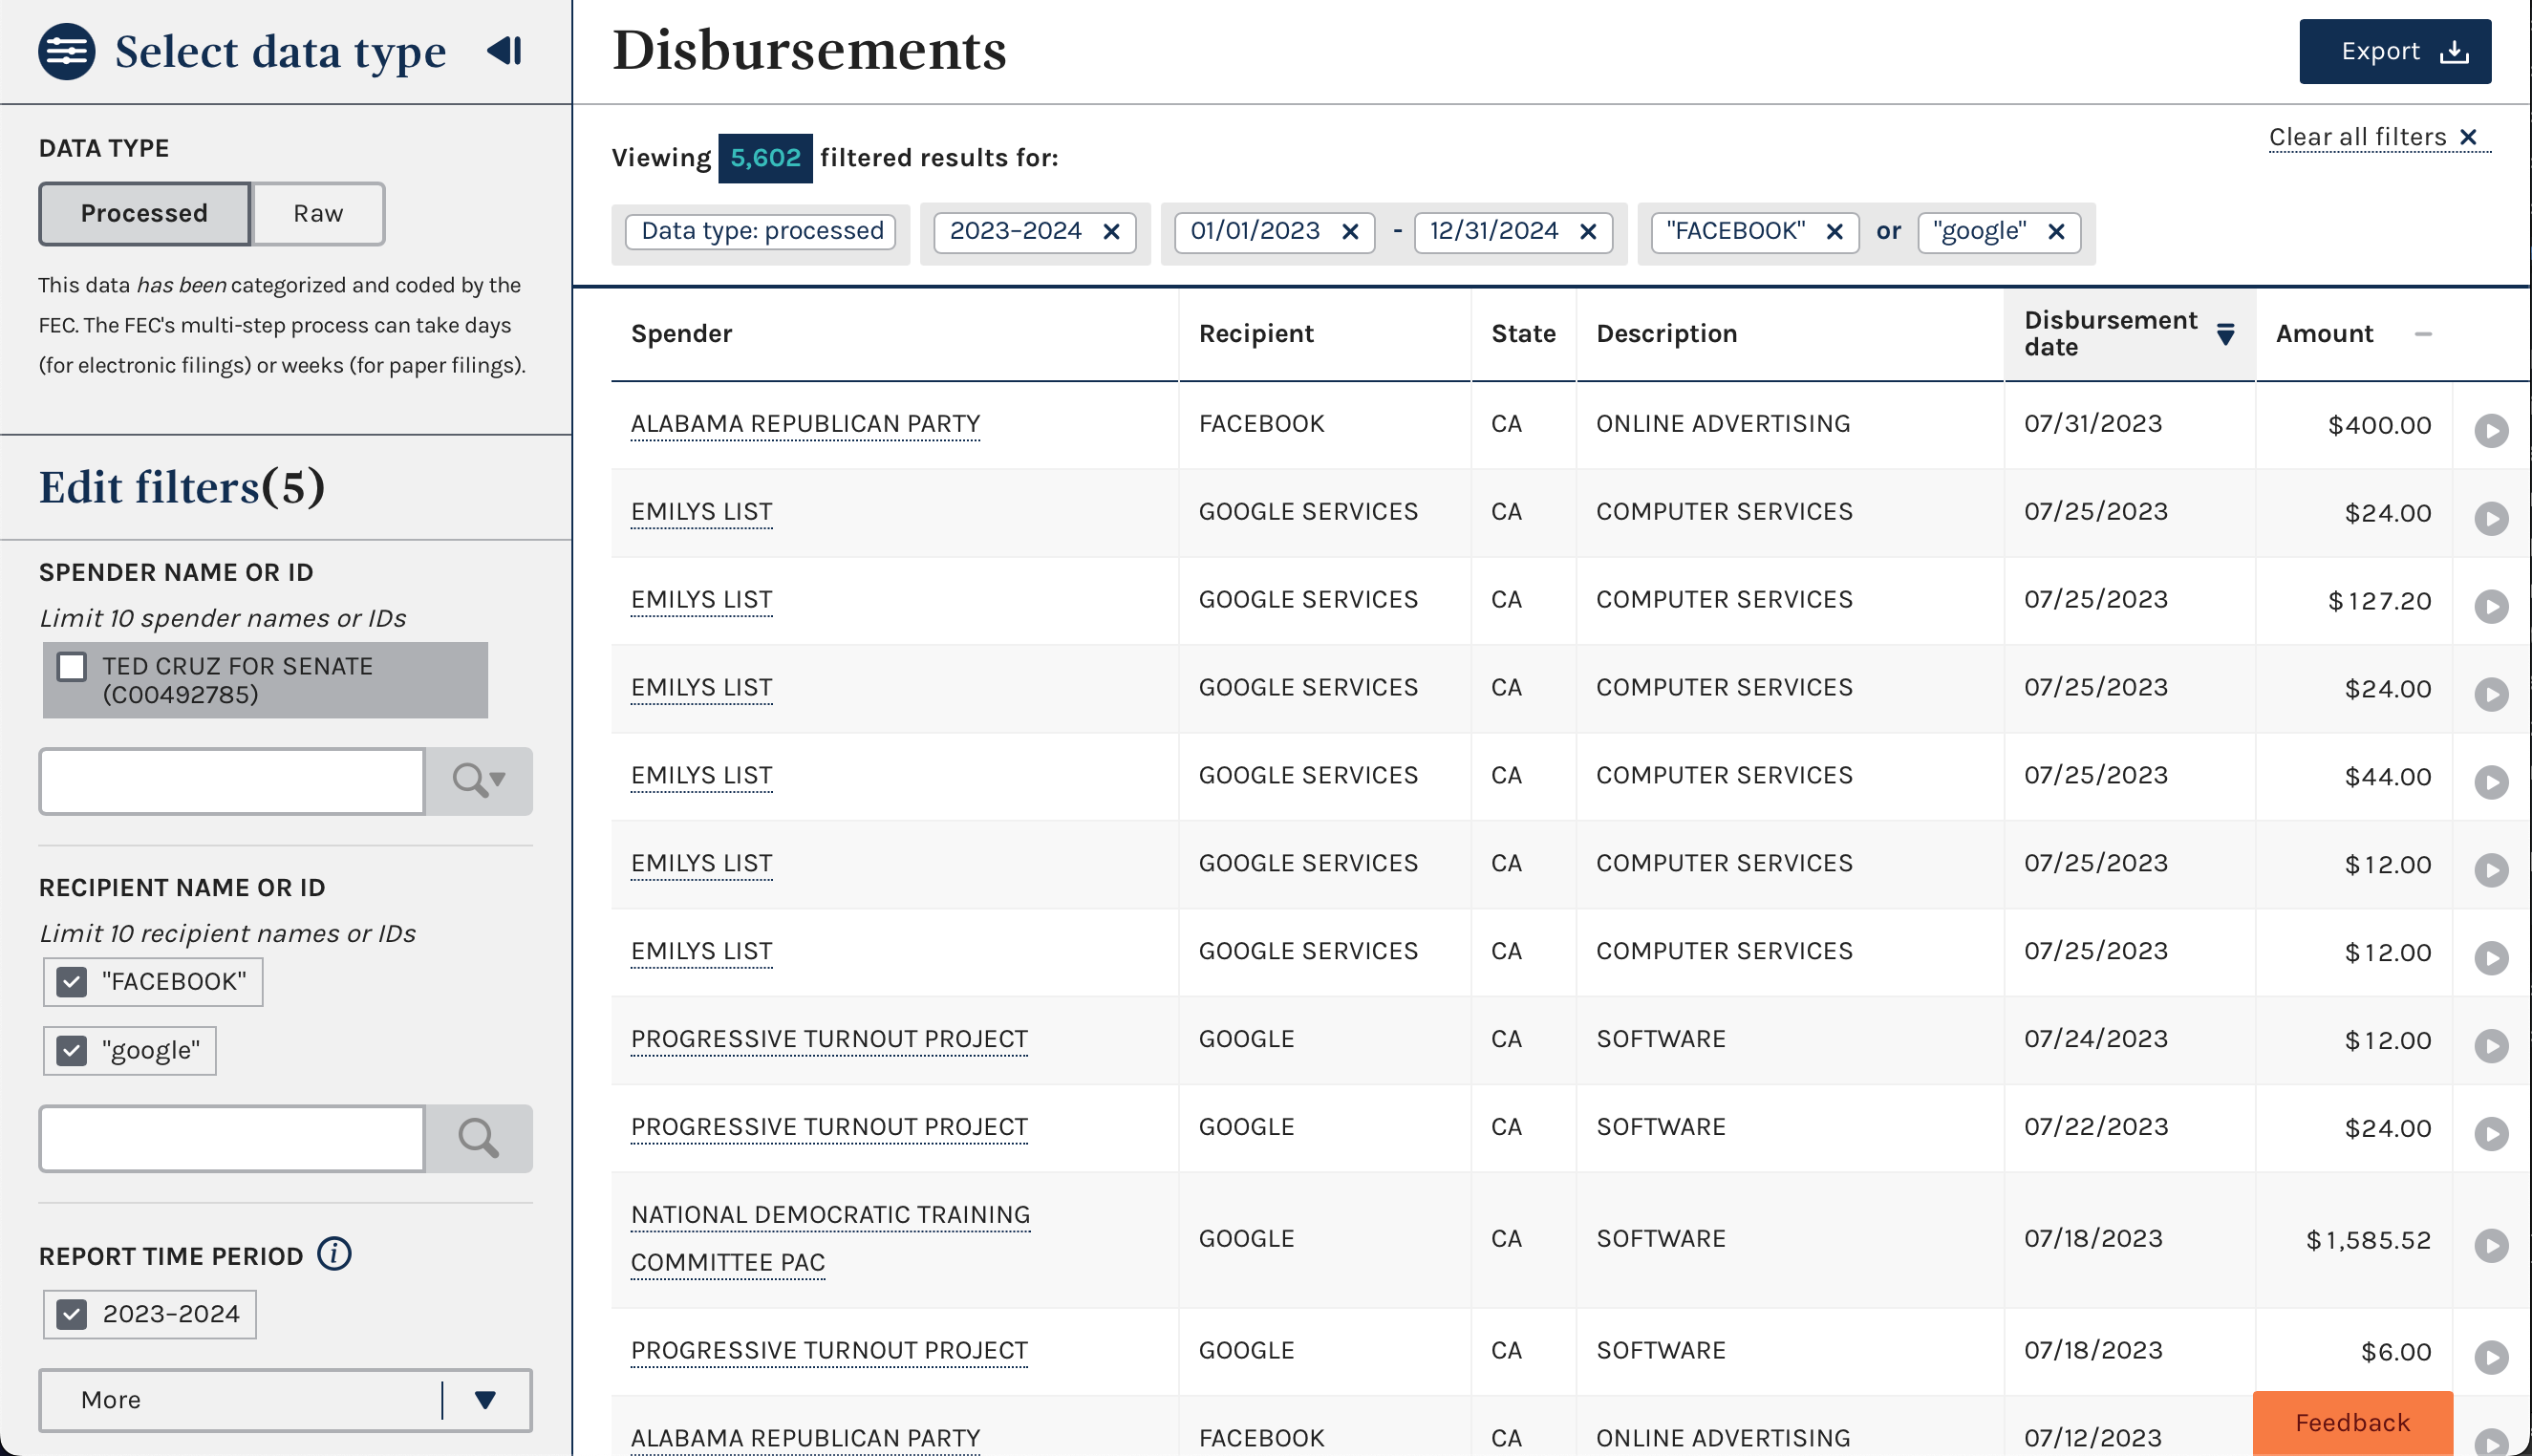
Here I can search for companies that are recipients of funds coming from political committees. I can search and filter on all the dimensions of data that I’d expect. Spender name. Recipient name. Time period. Scrolling down the page beyond what’s in the image, there are additional detailed dimensions. In the upper right corner there’s a nice Export button to give the data in csv format. The data output is a line by line readout of the data in the expenditure file for lines matching the search conditions. Exporting this data to csv means we can open it in a tool like Excel to explore the data, start playing with pivot tables, and make some exploratory charts and graphs. The more advanced folks will use something like R or Python and its ecosystem for data transformation and professional reporting and graphic solutions. The experts among us will be able to discern the narratives and influences that go into campaign fundraising and expenditures. Ultimately, this leads into political strategy, election campaign strategy, and how to execute a strategy to get elected.
There is a direct line from fundraising to outcomes in the world that most people can’t see. I’d like to change that. While the FEC provides all the data and a good UX to get it, the site doesn’t allow for outside-the-box reporting. There isn’t a great way to get data on an entire race, including all candidates, sources of income, expenditure outflows; there’s no way to explore the data in aggregate. Individual data points are great. Data exports are great. The FEC is certainly doing the right thing when it comes to making this data available. I think there is a lot of opportunity to go further than what the FEC provides in the raw. Which is why I built a platform to slice and report on the data in ways that provide for:
custom reporting across time, location, race for office.
tie fundraising to expenditures to truly “follow the money”.
provide comparison of historical performance for candidates and context for race for office.
automated reporting and visualization.
I want to make aggregate reports, charts, and graphs available to interested parties making strategic decisions. This is obviously a benefit to candidates and PACs/Super PACs. But there are many other audiences out there that can benefit. Executives at companies that work with political candidates. Product managers that want to make data-driven decisions. Lawyers advising clients on federal contribution limits. Marketing executives who want to analyze ad spend and optimize digital campaigns. Media consultants trying to place TV/radio ads. Journalists who want to see the story right now rather than dig through data month after month looking for a story. There is a lot of ground to cover beyond the FEC UX.
Friday posts might be more technical in the future. I wanted to outline the “why” regarding this data platform I built so that people can see the value proposition before we get into the details. I wrote this in part to delineate where the FEC functionality ends and where my functionality begins. I wanted to reaffirm with myself that there is still a value proposition here beyond a resume building experience with data warehouses, data pipelines, ETL workflows, complex data transformations, charts, and graphs.
For now, I will leave you with this, the only technical diagram I made for today’s post.
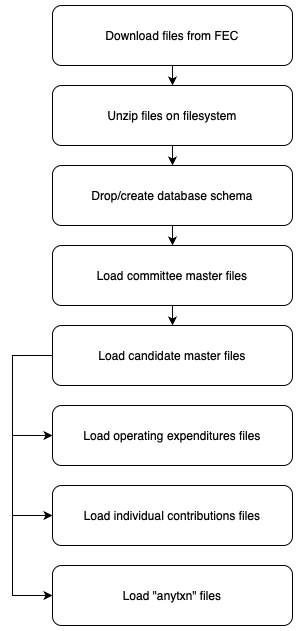
Looks pretty simple, right? Download the data from the FEC. Those files are in zip format. We need to unzip those files to get the line-by-line data filed by every committee. Then we create a database schema based on data in the files. And now we can load the files, starting with each committee, then each candidate. Once the committees and candidates are loaded, we can load the contributions from individuals, contributions from committee to committee, operating expenditures, and expenditures by Super PACs in parallel. There are hundreds of files that come from the FEC. Loading them sequentially, one at a time, would take far longer than is useful for reporting purposes. Hundreds of files and multiple CPU cores allows for parallel loading which cuts the load time from weeks to about a day for the full FEC data set. Doing the diff for just the current election year is very fast once the full data set is loaded. Staying up to date is easy and automated.
What kinds of reports on US federal campaign finance do you want to see? There are no limits provided there is data on the subject. Submit your custom report request in the comments and I’ll see what I can do.