
The Unreasonable Effectiveness of Building in Public
The act of writing this post helped me understand what I understand.

I realized I made a mistake. I wrote some software and it does the wrong thing. I’m unable to provide the kind of results I’d like to discuss today. That’s the good news. There’s no bad news and there’s more good news: I get to write about my previous understanding of the situation and confirm my new understanding.
Today is Monday. Monday’s topic is supposed to be a discussion about the campaign fundraising in US federal elections. Topics like grassroots impact on a race, party performance vs. candidate performance, comparison of campaigns and races against historical context. Instead of getting into that topic deeply, we can only scratch the surface due to incomplete and incorrect data in a report generated from software I wrote.
The software I wrote helps me understand the FEC bulk download data in aggregate. The in aggregate is the important part. The FEC website provides an interface to search for contributions to candidates with obvious search criteria like name, address, town, state. The site provides a similar interface for expenditures. Search criteria for expenditures are similar to contributions, replace contributor with recipient and you’re nearly there.
The problem comes in understanding what do all of those individual transaction amounts mean. We can’t understand the patterns in contributions. We can’t understand who are the big winners on the expenditures side. While we have every individual transaction available and searchable in a pretty performant UI, the level of granularity is much too fine for anyone to make meaningful decisions on it.
I’d like to know where the most money is flowing from candidates to private organizations and publicly traded companies. This includes both total dollars spend and total number of transactions with that vendor. In US federal elections, candidates do not spend money individually themselves. Campaign expenses are paid for by committees associated with a particular candidate, or political party, or other political causes. Please note perhaps a most understated way of saying “Super PACs” in the previous sentence. Super PACs are a topic for another day (many, many other days).
A committee is associated with a candidate for the purpose of fundraising and then spending those raised funds on things to get the candidate elected. The committee spends money, reports expenses to the FEC, and then we get to write reports against those transactions.
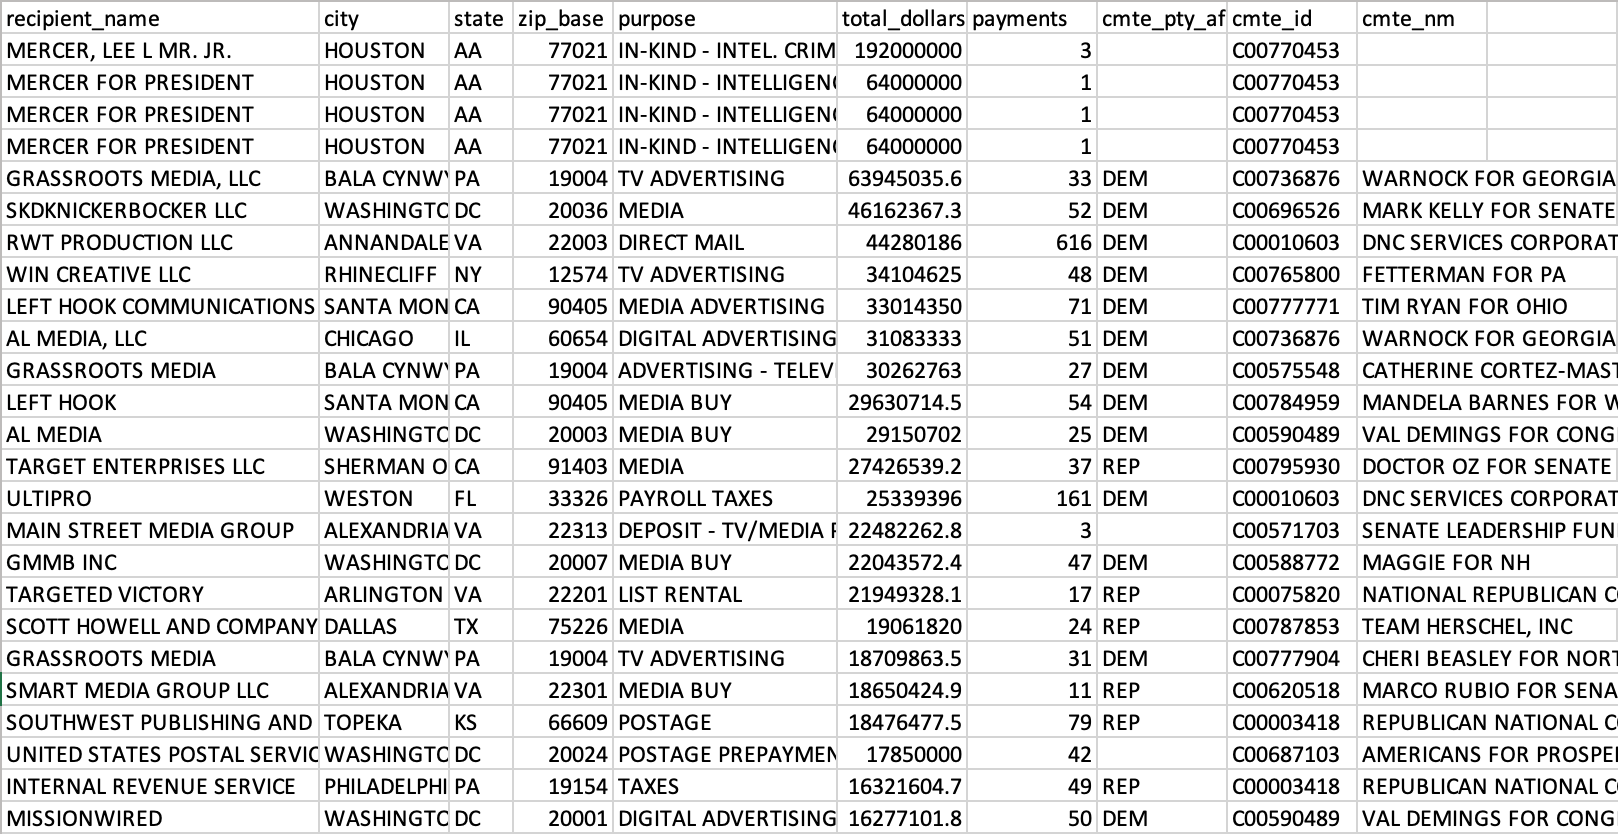
Here’s the kind of report we can write with the tools I built. This report comes from a query against a data warehouse that holds the FEC data. Unfortunately, this report is completely incorrect. The mistake I mentioned earlier was that I loaded independent expenditure data into the contributors table because the schemas look nearly identical if you squint hard enough. The reports and visualizations do not pass the sniff test in regard to accuracy and correctness. In this report, we would expect the Super PACs to spend radically more money than DEM- or REP-affiliated committees.
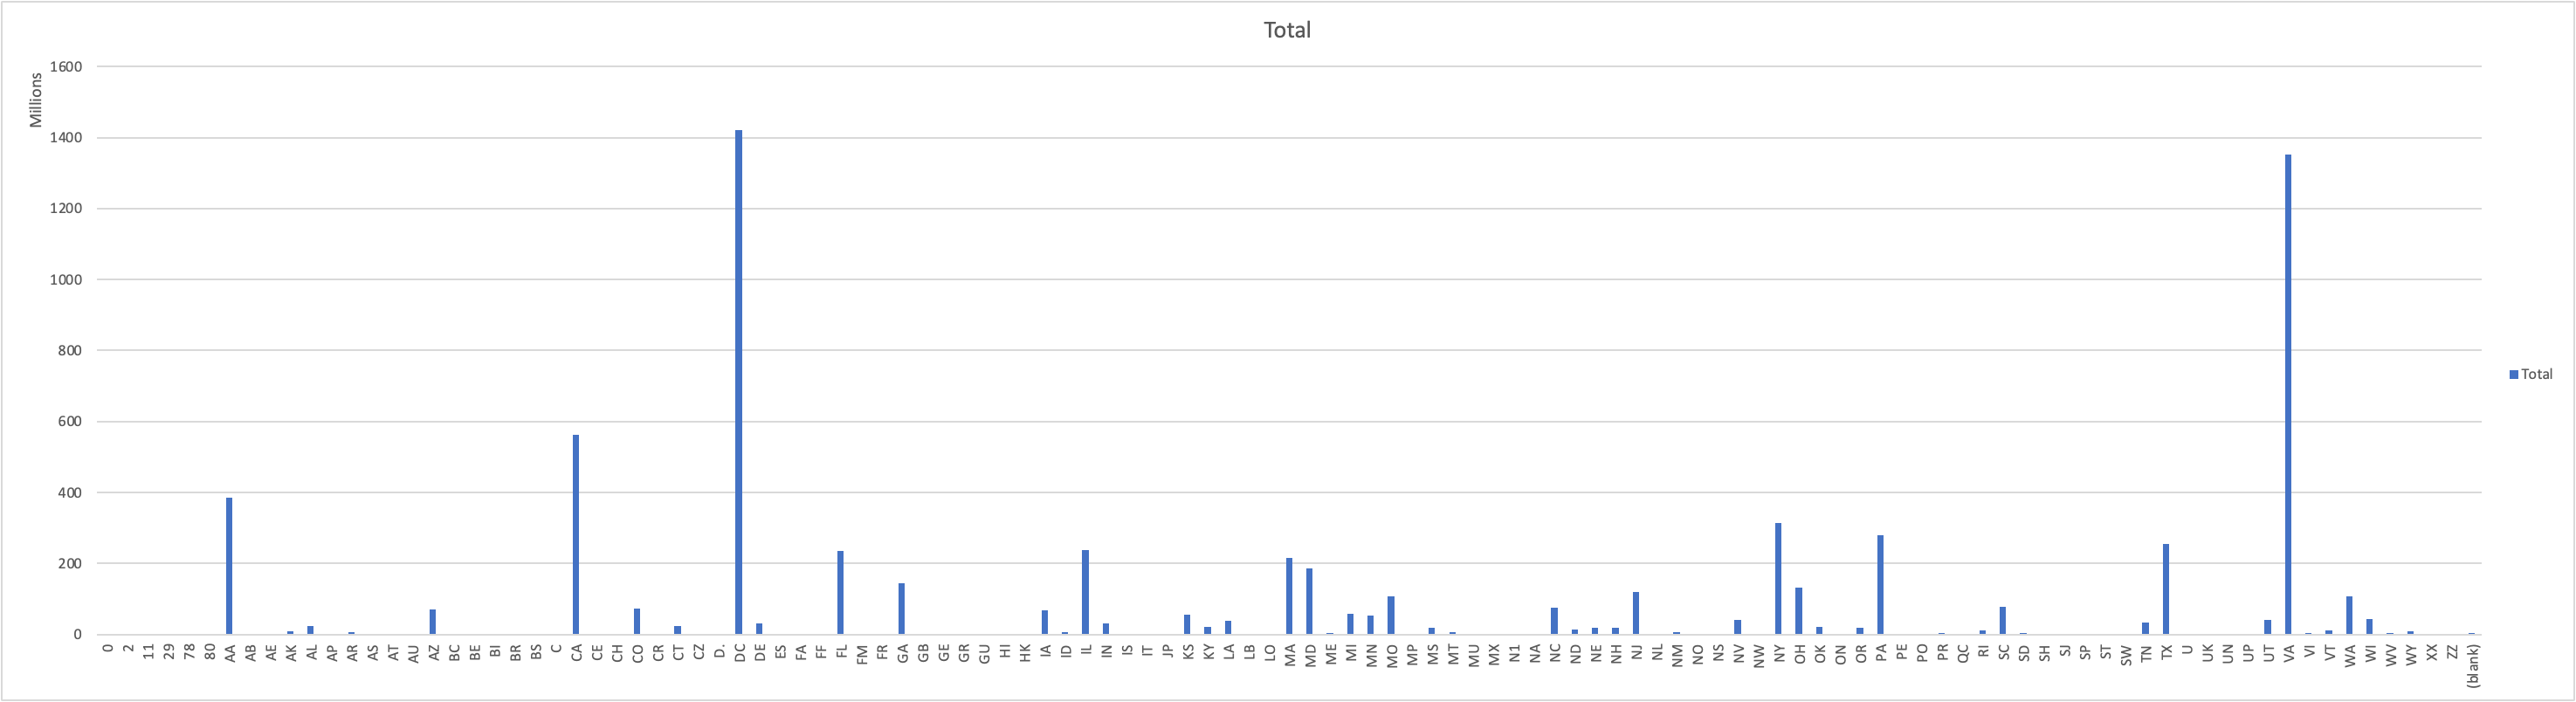
I didn’t bother cleaning up the junk data in this graph because I already know the real content is incorrect. The FEC data in the raw contains many invalid values and incomplete fields that make the internal consistency difficult to interpret. This (practice) graph shows there are a few big winners concerning states that most benefit from US federal elections. There is not a level playing field. Some states benefit dramatically more than others. How much? I need to put the independent expenditures in the right place to know. What we have now is worse than useless - it’s misleading.
What I’d like to do is take the data in the report above, and make some interesting visuals to understand the landscape of US political finance. That’s the intent of the Monday article. And that’s the importance of building in public. Preparing to post this graph, this report, and this article forced me to take stock of my understanding of the data from a third party, my understanding of the tools I built and my understanding of the files provided by the FEC, and my ability to critically think about the data in front of me to ensure correct, valid results before looking for a narrative.
The conclusion is that I need to reload the data warehouse from scratch. Drop schema. This is a little painful for me. Though I have an excellent M1 Pro MacBook, and though I took great pains to massively parallelize the data load, the process still takes over 24 hours from start to finish. That is the easy part. The more difficult part is correcting the end-location of the data so the reports have a complete set of data to export and visualize. I’ll discuss how it’s going in next Monday’s post.
Maybe not next week, but eventually we will have weekly posts on campaign fundraising and expenditures! Please subscribe to The Keys Report so you know what I’m working on. Stay subscribed to get the latest news and current events on campaign finance in the 2024 US federal election cycle.
Have you ever learned from your mistakes? Leave a comment and let me know!